


IPFS News Link • Precious Metals
Riding the Second Gold Bubble
• UltraLongNo matter which gold price diagram you look, the price of gold seems to
be going upwards. As we rise above old all time highs, is it just a huge
bubble or is the price justified?
Take advantage of the coming reditribution of wealth
110 years of gold price history
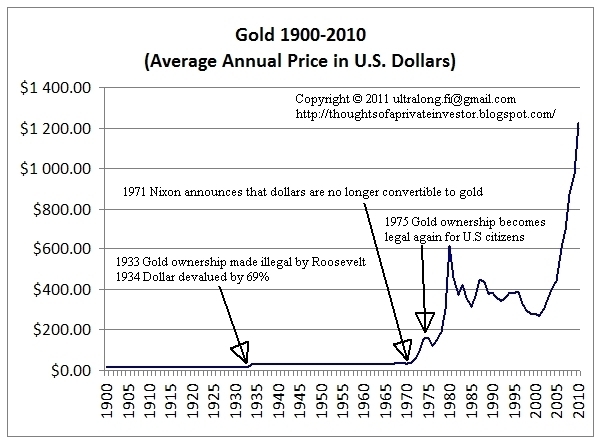
I wanted to look further than the customary 10 year charts available. Let’s start by 110 years of gold price history:
I wanted to look further than the customary 10 year charts available. Let’s start by 110 years of gold price history:
The
price of gold in dollar terms was pretty flat until 1934, when the
dollar was devalued against gold by 69%. In the previous year Franklin
D. Roosevelt declared gold ownership illegal and U.S citizens were
required to sell all their gold to the Federal Reserve at the official
exchange rate $20.67 an ounce. Gold ownership in USA was illegal until
1975.
After the Second World War, a system similar
to a Gold Standard was established by the ”Bretton Woods Agreement”.
Under this system, many countries fixed their exchange rates relative to
the U.S. dollar and U.S. promised to fix the price of gold at
approximately $35 per ounce. [source: Wikipedia]
The
system broke down in 1971 when U.S. announced that dollars were no
longer convertible to gold. This was the result of France converting its
dollar reserves to gold (calling U.S. bluff), fiscal strain of federal
government due to expenditures for the Vietnam War and persistent
balance of payments deficits. [source: Wikipedia] After 1971 the price of gold soared due to the reasons stated above, and due to high inflation.
Watch Streaming Broadcast Live:
LRN.fm
DLive
Live Chat

Telegram
Telegram


