


Program Date:
08-23-12 -- Bob Prechter, Elliott Wave (MP3 & Video) LOADED)
Hour 1 - 3
Media Type: Audio • Time: 122 Minutes and 0 Secs
Bob Prechter, author and stock market analyst using the Elliott Wave Principle,
on market trends and projections

August 23rd, 2012
Declare Your Independence with Ernest Hancock
on LRN.FM / Monday - Friday
9 a.m. - Noon (EST)
Studio Line: 602-264-2800
Hour 1
Here are some ways to view Freedom's Phoenix by Subject
or by radio show:
Freedom's Phoenix
Contents listed by Subject:
Listings of Program Archives for Radio Shows for Declare Your Independence with Ernest Hancock:
2012-08-23 Hour 1 Ernest goes over the news
(Video Archive):
Hour 2
Hour 2
Current News and Events
2012-08-23 Hour 2 Ernest goes over the news
(Video Archive):
Hour 3
Guests: Bb Prechter
Hour 3

Bob Prechter
Webpage: ElliottWave.Com
Robert R. Prechter, Jr. (b. 1949) is an American author and stock market analyst, known for his financial forecasts using the Elliott Wave Principle. Prechter is an author and co-author of 14 books, and editor of 2 books [1], his book Conquer the Crash is a New York Times bestseller.[2] He also has published monthly financial commentary in the newsletter The Elliott Wave Theorist since 1979, and is the founder of Elliott Wave International and New Classics Library.[3][4] Prechter served on the board of the Market Technicians Association for nine years, and as the Association's President in 1990-1991. In
recent years Prechter has supported the study of socionomics, a theory
about human social behavior.[5][6]
About Elliott Wave International:
Elliott Wave International (EWI) is the world’s
largest market forecasting firm. EWI’s 20-plus analysts
provide around-the-clock forecasts of every major market
in the world via the internet and proprietary web systems
like Reuters and Bloomberg. EWI’s educational services
include conferences, workshops, webinars, DVDs, streaming
videos, special reports, books and one of the internet’s
richest free content programs, Club EWI.
Elliott Wave personality and characteristics
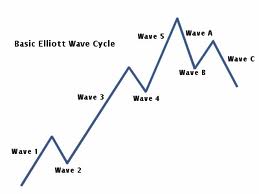
Elliott wave analysts (or Elliotticians) hold that each individual wave has its own signature or characteristic, which typically reflects the psychology of the moment.[2][3] Understanding those personalities is key to the application of the Wave Principle; they are defined below. (Definitions assume a bull market in equities; the characteristics apply in reverse in bear markets.)
Five wave pattern (dominant trend) Three wave pattern (corrective trend)| Wave 1: Wave one is rarely obvious at its inception. When the first wave of a new bull market begins, the fundamental news is almost universally negative. The previous trend is considered still strongly in force. Fundamental analysts continue to revise their earnings estimates lower; the economy probably does not look strong. Sentiment surveys are decidedly bearish, put options are in vogue, and implied volatility in the options market is high. Volume might increase a bit as prices rise, but not by enough to alert many technical analysts. | Wave A: Corrections are typically harder to identify than impulse moves. In wave A of a bear market, the fundamental news is usually still positive. Most analysts see the drop as a correction in a still-active bull market. Some technical indicators that accompany wave A include increased volume, rising implied volatility in the options markets and possibly a turn higher in open interest in related futures markets. | |
| Wave 2: Wave two corrects wave one, but can never extend beyond the starting point of wave one. Typically, the news is still bad. As prices retest the prior low, bearish sentiment quickly builds, and "the crowd" haughtily reminds all that the bear market is still deeply ensconced. Still, some positive signs appear for those who are looking: volume should be lower during wave two than during wave one, prices usually do not retrace more than 61.8% (see Fibonacci section below) of the wave one gains, and prices should fall in a three wave pattern. | Wave B: Prices reverse higher, which many see as a resumption of the now long-gone bull market. Those familiar with classical technical analysis may see the peak as the right shoulder of a head and shoulders reversal pattern. The volume during wave B should be lower than in wave A. By this point, fundamentals are probably no longer improving, but they most likely have not yet turned negative. | |
| Wave 3: Wave three is usually the largest and most powerful wave in a trend (although some research suggests that in commodity markets, wave five is the largest). The news is now positive and fundamental analysts start to raise earnings estimates. Prices rise quickly, corrections are short-lived and shallow. Anyone looking to "get in on a pullback" will likely miss the boat. As wave three starts, the news is probably still bearish, and most market players remain negative; but by wave three's midpoint, "the crowd" will often join the new bullish trend. Wave three often extends wave one by a ratio of 1.618:1. | Wave C: Prices move impulsively lower in five waves. Volume picks up, and by the third leg of wave C, almost everyone realizes that a bear market is firmly entrenched. Wave C is typically at least as large as wave A and often extends to 1.618 times wave A or beyond. | |
| Wave 4: Wave four is typically clearly corrective. Prices may meander sideways for an extended period, and wave four typically retraces less than 38.2% of wave three (see Fibonacci relationships below). Volume is well below than that of wave three. This is a good place to buy a pull back if you understand the potential ahead for wave 5. Still, fourth waves are often frustrating because of their lack of progress in the larger trend. | ||
| Wave 5: Wave five is the final leg in the direction of the dominant trend. The news is almost universally positive and everyone is bullish. Unfortunately, this is when many average investors finally buy in, right before the top. Volume is often lower in wave five than in wave three, and many momentum indicators start to show divergences (prices reach a new high but the indicators do not reach a new peak). At the end of a major bull market, bears may very well be ridiculed (recall how forecasts for a top in the stock market during 2000 were received). | ||
News Link • 
Voting and Elections
Social Science Research Network article by Bob Prechter et al on Elections and Voting Results
08-23-2012 • ww.ssrn.com
Social Mood, Stock Market Performance and U.S. Presidential Elections: A Socionomic Perspective on Voting Results
Voting and Elections
Social Science Research Network article by Bob Prechter et al on Elections and Voting Results
08-23-2012 • ww.ssrn.com
Social Mood, Stock Market Performance and U.S. Presidential Elections: A Socionomic Perspective on Voting Results
2012-08-23 Hour 3 Bob Prechter (ElliottWave.Com)
on market trends and projections
(Video Archive):
Watch Streaming Broadcast Live:
LRN.fm
DLive
Live Chat

Telegram
Telegram


