


IPFS
When This Stock Market Signal Flashes, It's Time to Get Short
Written by Sierra Hancock Subject: Economy - Economics USA
When This Stock Market Signal Flashes, It's Time to Get Short
 Jeff Clark
Periods of low volatility in the stock market are always followed by periods of high volatility. Always.
It's as certain as spring following winter.
Of course, when you're suffering through temperatures that would
make an Eskimo shiver, it's hard to remember spring is on its way. And
when stocks are a one-way bet, when the market moves higher day after
day in unending bullishness, it's hard to imagine it moving in the other
direction.
But it always does. You can bet on it.
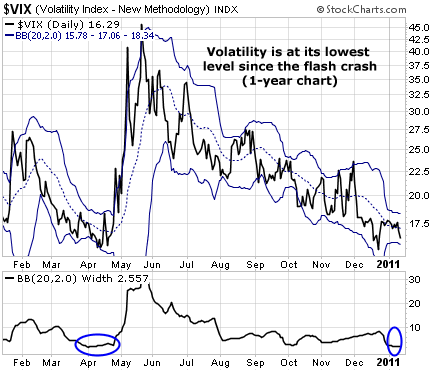
By the look of the Volatility Index (VIX), the market may be about to change temperature...
The blue lines on the chart are the Bollinger Bands. They indicate
the range of volatility on a chart. When the Bollinger Bands squeeze
closer together, as they're doing right now, it indicates a period of
contracting volatility. When they expand, as they did back in May, it
indicates a period of high volatility. One always follows the other.
The bottom graph charts the width of the Bollinger Bands. The width
is now as narrow as it was last April – just before the "flash crash"
and the start of a 20% correction in the S&P 500. There are many
other similarities between today's market environment and that of last
April. Investor sentiment is wildly bullish. And there are multiple
technical divergences.
The biggest warning sign, however, is coming from the VIX and the contracting Bollinger Bands. This condition existed for several weeks last spring before stocks finally got hit. So the bullish party may continue for a little while longer.
Now is definitely not the time to get complacent. Keep an eye on
the VIX. When the Bollinger Bands start to expand, we'll know the long
awaited correction has finally arrived. Long-term investors should head
for the sidelines. Short-term traders can speculate with short sales and
put options.
Best regards and good trading,
Further Reading:
Last year, Jeff used this same indicator to nail a
massive jump in volatility. "It feels as though stocks are a one-way
upside bet," Jeff wrote. "The action in the Volatility Index, however,
is suggesting otherwise." That was less than a month before the "flash
crash." See the setup here: A Rare Trading Signal from the Volatility Index.
When the VIX hit a six-month low in October, it created a great
opportunity for investors. "No matter if you're bullish or bearish,
speculating just got cheaper," he wrote. The same is true today. Get the
details here: A Great Week to Speculate.
Watch Streaming Broadcast Live:
LRN.fm
DLive
Live Chat

Telegram
Telegram


